A little knowledge is a dangerous thing. Or so the saying goes. When specifying and buying computer hardware it saves time and money knowing the level of performance you get with your existing equipment and the performance you can expect from your new purchase.
There are numerous metrics to measure but in order to obtain meaningful results (relatively) quickly I personally focus on CPU, memory and file and network I/O.
The key tools I use to measure performance are:
- dd – file/network I/O
- SysBench – CPU, Memory and file/network I/O
- iperf – network I/O
- IOzone – file/network I/O
dd
dd is a simple command which copies standard input to standard output. As a result by directing input/output from and to various destinations we can measure their read and write performance.
To measure write performance:
dd if=/dev/zero of=tmp.bin bs=2048k count=5k && sync
To measure read performance:
dd if=tmp.bin of=/dev/null bs=2048k count=5k && sync
Since block size is 2048k (2MB) your output file tmp.bin will be double the size of your count figure. So for example to test a file size of 10GB specify a count value of 5k.
Aim to test a file size of 2x your system memory. Otherwise you’ll end up caching a lot of your result and hit memory rather than disk.
Output:
10737418240 bytes transferred in 80.956609 secs (132631769 bytes/sec)
Here we’re observing bandwidth of 132631769 bytes/sec or 132MB/s.
Script It!
Takes two arguments, destination and size in GB of the test file.
#!/bin/sh

# Default size in GB
SIZE=100

if [ "$1" = "" ]; then
 echo "Destination path missing"
 exit 1
fi

if [ "$2" != "" ]; then
 SIZE=$2
fi

DEST=$1
COUNT=$(($SIZE / 2))k

echo "Starting Write Test"
dd if=/dev/zero of="$DEST/tmp.bin" bs=2048k count=$COUNT && sync
echo "Completed Write Test"
echo ""
echo "Starting Read Test"
dd if="$DEST/tmp.bin" of=/dev/null bs=2048k count=$COUNT && sync
rm "$DEST/tmp.bin"
echo "Removed test file"
echo "Completed Read Test"
SysBench
SysBench is a benchmarking application which covers a range of performance tests to measure CPU, memory, file IO and MySQL performance.
It can be used with very little setup and allows you to quickly get an idea of overall system performance.
CPU
Execute:
sysbench --test=cpu run
By default the process runs in 1 thread. Specify –num-threads=X for multiprocessor systems where X is the number of CPU cores.
Output:
sysbench 0.4.12: multi-threaded system evaluation benchmark

Running the test with following options:
Number of threads: 1

Doing CPU performance benchmark

Threads started!
Done.

Maximum prime number checked in CPU test: 10000

Test execution summary:
total time: 10.4933s
total number of events: 10000
total time taken by event execution: 10.4909
per-request statistics:
min: 0.99ms
avg: 1.05ms
max: 2.17ms
approx. 95 percentile: 1.27ms

Threads fairness:
events (avg/stddev): 10000.0000/0.00
execution time (avg/stddev): 10.4909/0.00
The key figure to look out for is total time: 10.4933s.
Memory
Execute (read):
sysbench --test=memory run
Execute (write):
sysbench --test=memory --memory-oper=write run
Output:
sysbench 0.4.12: multi-threaded system evaluation benchmark

Running the test with following options:
Number of threads: 1

Doing memory operations speed test
Memory block size: 1K

Memory transfer size: 102400M

Memory operations type: write
Memory scope type: global
Threads started!
Done.

Operations performed: 104857600 (2187817.58 ops/sec)

102400.00 MB transferred (2136.54 MB/sec)

Test execution summary:
 total time: 47.9279s
 total number of events: 104857600
 total time taken by event execution: 40.6687
 per-request statistics:
 min: 0.00ms
 avg: 0.00ms
 max: 4.36ms
 approx. 95 percentile: 0.00ms

Threads fairness:
 events (avg/stddev): 104857600.0000/0.00
 execution time (avg/stddev): 40.6687/0.00
The key figures to look out for are the transfer rates MB/sec or ops/sec values.
File I/O
Measuring storage performance is a very tricky beast. There are many variables at play from the bandwidth of the interconnect (SATA 3Gb or 6Gb, Ethernet 10Gb or 1Gb etc.) to the amount of memory the system has which affects how much of the benchmark is hitting memory instead of disk. On top of that you need to be aware of the type of data you’ll be pushing; does it involve a lot of small sized random I/O or larger files with a lot of sequential I/O.
For example a database or virtual machine disk store will have a small block size with a lot of random I/O. Large ISOs or media files will have larger block sizes with a lot of sequential I/O. How you specify your storage server will drastically affect its performance in these cases, particularly with random I/O which is the most demanding case.
If a storage system can handle random I/O well it can certainly handle sequential I/O too which is why a lot of storage reviews will tend to focus on random performance. It also requires significantly less exotic (and expensive) hardware to engineer a well performing storage system for lots of sequential I/O so bear this in mind when determining your storage needs. You probably won’t need SSD backed read/write caches or high RPM drives if you’ll be serving media.
Prepare
When using Sybench’s fileio benchmark you will need to create a set of test files to work on.
Execute:
sysbench --test=fileio --file-total-size=4G prepare
It is recommended that the size set using –file-total-size is at least 2x larger than the available memory to ensure that file caching does not influence the workload too much.
Run
Execute:
sysbench --test=fileio --file-total-size=4G --file-test-mode=rndrw --max-time=240 --max-requests=0 --file-block-size=4K --num-threads=4 --file-fsync-all run
The I/O operations to use can be specified using –file-test-mode which takes the values seqwr (sequential write), seqrewr (sequential rewrite), seqrd (sequential read), rndrd (random read), _rndwr (random write) and rndrw (random reead/write)._
Generally the higher you set –num-threads the higher your result. Beyond a certain point however performance will start to level off. This will tend to happen with a thread count 2x the number of CPUs on the test system.
If testing random I/O a file block size of 4K is suggested using –file-block-size. For sequential I/O use 1M.
Setting the option –file-fsync-all only affects the rndwr and rndrw tests. It forces flushing to disk before moving onto the next write. You would want to do this to emulate very demanding cases such as VMware and NFS stores which force sync on write. Performance is drastically degraded with this option. By default sysbench flushes the writes to disk after 100 writes.
By default sysbench fileio executes 10000 requests. In order to produce effective benchmarks within a period of time we set the –max-requests value to 0 which is unlimited.
We then set the max-time value to a logical value based upon the file-total-size value in order to ensure the test doesn’t execute requests indefinitely. 240 seconds is a good value for sizes of 4G, for larger sizes such as 60G a time of_ 720_ seconds is good.
Output:
sysbench 0.4.12: multi-threaded system evaluation benchmark

Running the test with following options:
Number of threads: 1

Extra file open flags: 0
128 files, 32Mb each
4Gb total file size
Block size 16Kb
Number of random requests for random IO: 10000
Read/Write ratio for combined random IO test: 1.50
Periodic FSYNC enabled, calling fsync() each 100 requests.
Calling fsync() at the end of test, Enabled.
Using synchronous I/O mode
Doing random r/w test
Threads started!
Done.

Operations performed: 6000 Read, 4000 Write, 12800 Other = 22800 Total
Read 93.75Mb Written 62.5Mb Total transferred 156.25Mb (40.973Mb/sec)
 2622.29 Requests/sec executed

Test execution summary:
 total time: 3.8135s
 total number of events: 10000
 total time taken by event execution: 0.3151
 per-request statistics:
 min: 0.00ms
 avg: 0.03ms
 max: 5.88ms
 approx. 95 percentile: 0.02ms

Threads fairness:
 events (avg/stddev): 10000.0000/0.00
 execution time (avg/stddev): 0.3151/0.00
The key figures to look at are the transfer rates MB/sec and Requests/sec which basically equates to your IOPS figure.
A bug in the fileio output shows the bit abbreviation but shows the numerical byte value.
Cleanup
Execute:
sysbench --test=fileio --file-total-size=4G cleanup
To cleanup simply run the above command and the various temp files used to run the fileio test will be removed.
Script It!
Here’s a little script I use to quickly test File I/O performance using sysbench. Simply call it from the folder on the storage device or network share you want to benchmark:
#!/bin/bash

# Set to 2x RAM
FILE_TOTAL_SIZE="4G"

#Set to long enough to complete several runs
MAX_TIME="240"

#For random IO set to 4K otherwise set to 1M for sequential
FILE_BLOCK_SIZE="4K"

logdate=$(date +%F)

echo "Preparing test"
sysbench --test=fileio --file-total-size=$FILE_TOTAL_SIZE prepare

echo "Running tests"
for run in 1 2 3; do
 for each in 1 4 8 16 32 64; do
 echo "############## Running Test - Write - Thread Number:" $each "- Run:" $run "##############"
 sysbench --test=fileio --file-total-size=$FILE_TOTAL_SIZE --file-test-mode=rndwr --max-time=$MAX_TIME --max-requests=0 --file-block-size=$FILE_BLOCK_SIZE --num-threads=$each --file-fsync-all run > log-$logdate-write-${each}T-${run}R.log

 echo "############## Running Test - Read - Thread Number:" $each "- Run:" $run "##############"
 sysbench --test=fileio --file-total-size=$FILE_TOTAL_SIZE --file-test-mode=rndrd --max-time=$MAX_TIME --max-requests=0 --file-block-size=$FILE_BLOCK_SIZE --num-threads=$each run > log-$logdate-read-${each}T-${run}R.log
 done
done

echo "Cleaning up"
sysbench --test=fileio --file-total-size=$FILE_TOTAL_SIZE cleanup
IOzone
IOzone is an incredibly comprehensive file IO measurement application. It provides in depth analysis of filesystem performance and measures it across three axis; file size, transfer size and performance.
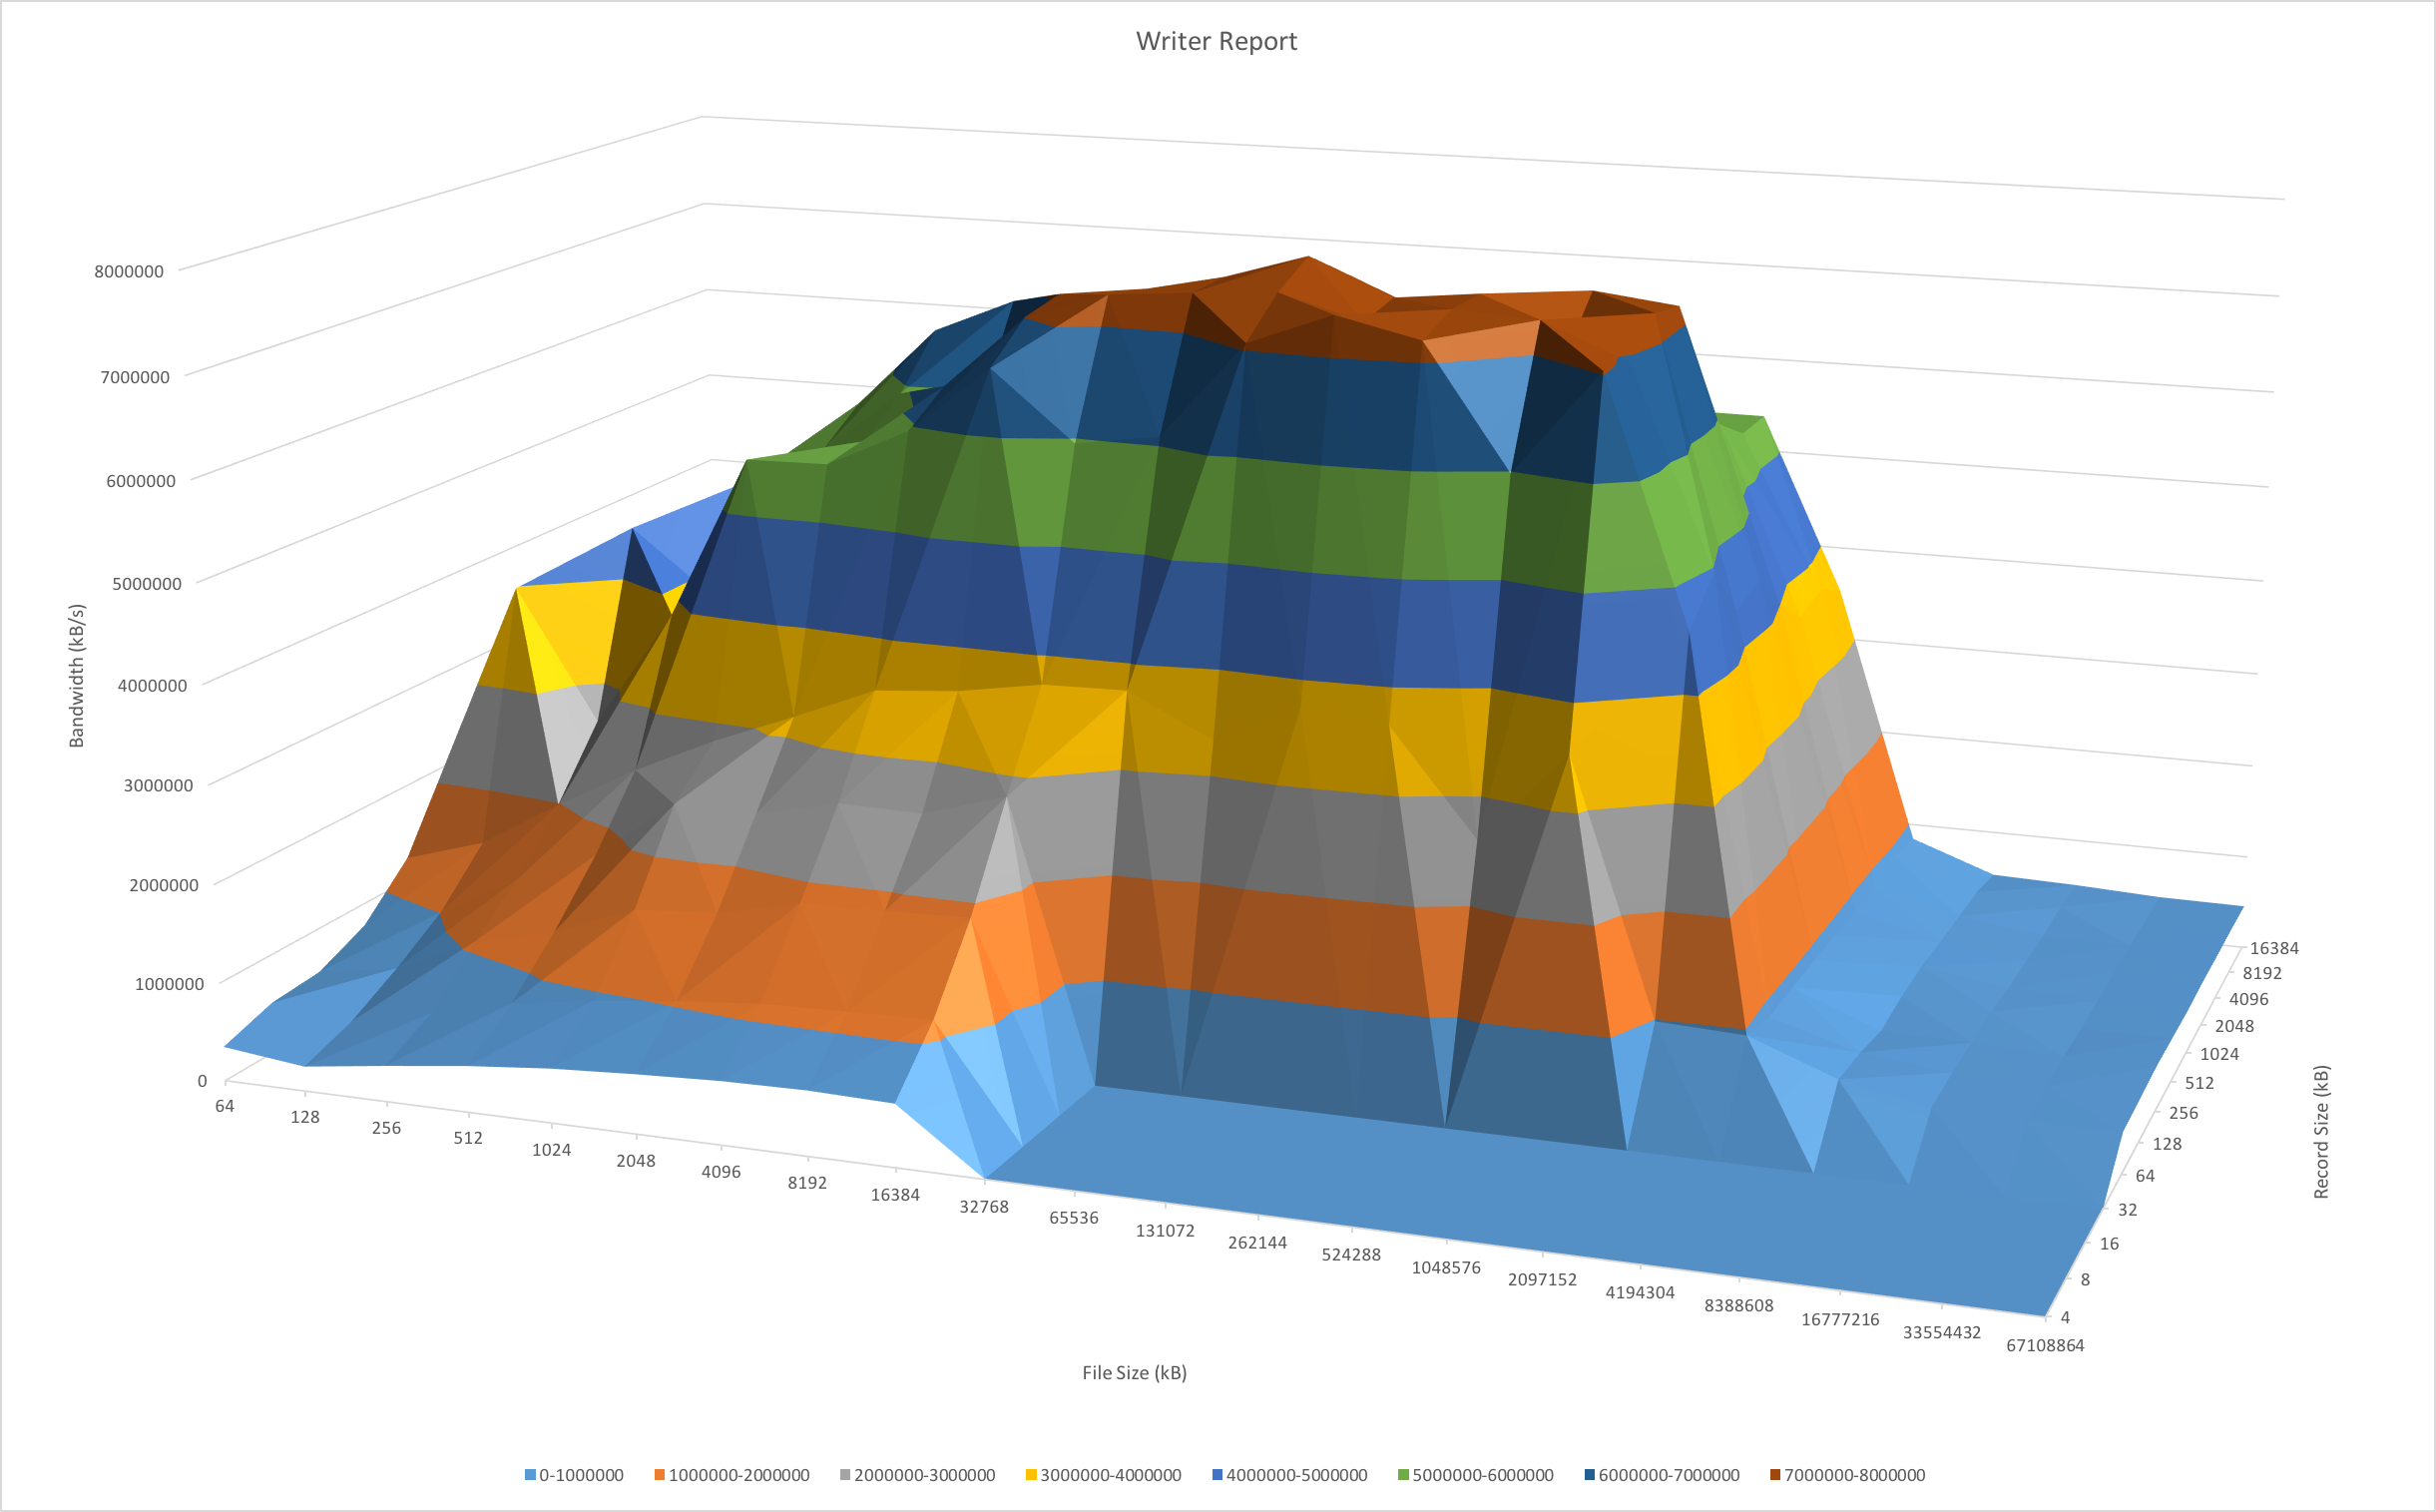
It also lets you easily produce pretty graphs like this which show the performance effect of CPU cache, memory cache and raw disk speed performance:
With iozone there are two scenarios I typically measure:
- Direct Attached Storage (DAS)
- Network Attached Storage (NAS)
To explain the commands below there are a few variables to set in both types of scenario. Firstly I set -g (size) to 2x RAM of the file server being measured. It takes a lot longer to test, especially with large amounts of memory, but the results are much more useful since they give a nice 3D surface chart which shows the sustained speeds you can expect for a given file size as it hits CPU cache, memory cache, SSD cache and finally spinning disks.
The argument -b produces a binary compatible spreadhseet which can be opened in Excel to produce 3D surface charts like below. You can see the measured performance decreases as file size exhausts the CPU cache (top strata) at (7 GB/s), buffer cache (next strata down) and finally hits spinning disks in the pale blue section at the bottom (450 MB/s). That last figure is our sustained speed at load.
Where the chart flatlines is where the result is unmeasured. Be sure to set option -z to avoid that!
Direct Attached Storage
Execute:
iozone -Raz -g 4G -f /mnt/ZFS_VOL/ZFS_DATASET/testfile -b iozone-MY_FILE_SERVER-local-size-4g.xls
Network Attached Storage
I use NFS for most of my server file stores. As a result these commands are NFS focused but should work on non-NFS storage as well.
Execute:
iozone -Razc -g 4G -U /mnt/MY_FILE_SERVER -f /mnt/MY_FILE_SERVER/testfile -b iozone-MY_FILE_SERVER-nfs-size-64g.xls
OR
iozone -RazcI -g 4G -f /mnt/MY_FILE_SERVER/testfile -b iozone-MY_FILE_SERVER-nfs-size-64g.xls
For NFS testing ideally you want to use the first argument which unmounts the NFS share between tests and removes the effect of caching. This requires an fstab entry so the test can mount/unmount successfully. Unfortunately I often encounter issues with the remount failing after a few tests. If you encounter that (or can’t be bothered to create an fstab entry) use -I which uses DIRECT I/O for all file operations which tells the filesystem that all operations are to bypass the buffer cache and go directly to disk.
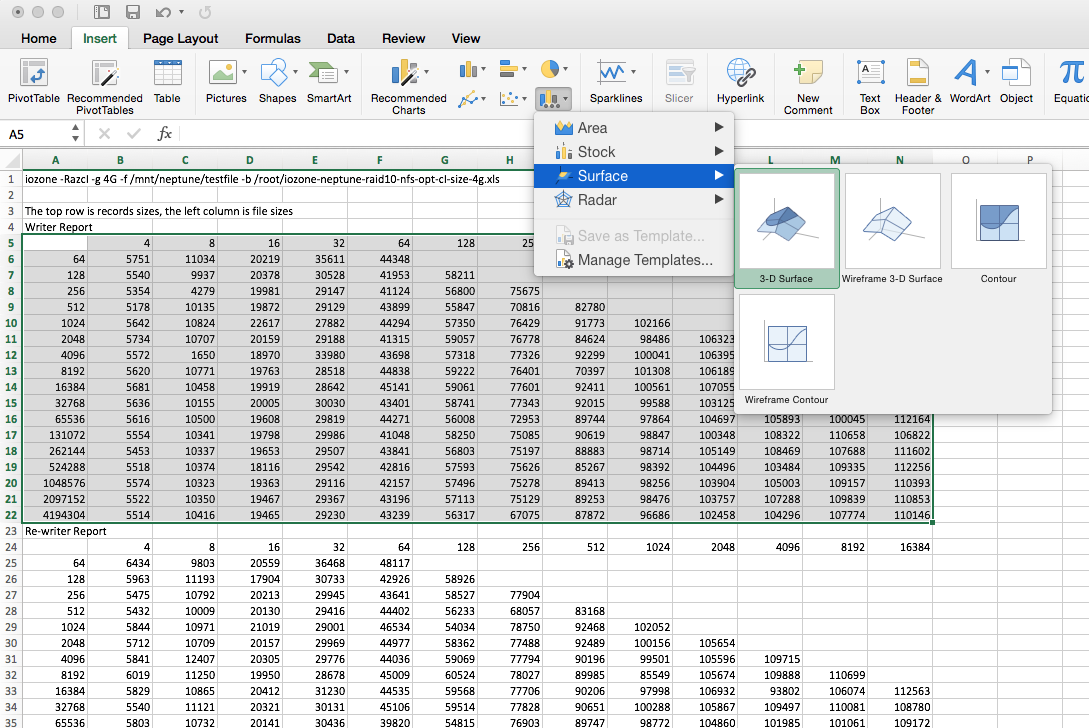
With your XLS file in hand open in Excel and checkout your performance. All figures are in kilobytes.
To produce a graph it’s pretty simple. Select the table, go to Insert and choose a 3D Surface graph.